Project - Social Change

Learning Intentions
- To learn how groups can push for social change in Canadian society
- To learn how to use background research, spreadsheets, and graphs to analyze social science data
Notes
This research project will look at how groups have pushed for change in Canadian society.
In a group of 2, you will choose a topic in Canadian society that interests you. You should choose a topic that has lots of data publicly available.
Some suggestions include:
- Discrimination against groups (Indigenous people, women, LGBTQIA2S+, people of colour, immigrants, religious/atheist groups, and more)
- Equality under the law (immigration, marriage, other rights)
- Acceptance in society (professions, as a neighbour, as a friend)
- Demographics in BC/Canada (link to Statistics Canada)
- Deaths (car accidents, childbirth, COVID-19, tuberculosis, violent crime, and more)
- Immigration
- Sales of products (electric cars, cell phones, and many more)
- Size of Canadian UN peacekeeping forces
- Education (high school graduation rate, college rate, literacy rates, and many more)
Assignment
- Background and Timeline
What issue are you studying? How long has it been an issue? What are some of the important dates related to this issue? - Stakeholders
Who is involved in this issue? Who benefits from the status quo? Who is harmed? How much power do they have? How motivated are they? - Actions
What strategies and tactics did the stakeholders use to advance their cause? What strategies and tactics were used to push back against the issue? Were they effective or not? - Data
Find data showing how your issue has changed over time. You need at least 15 data points, and the data must go back to at least 2000. Create a chart from the data.
Copy the chart to your text document, and label the important dates from your timeline.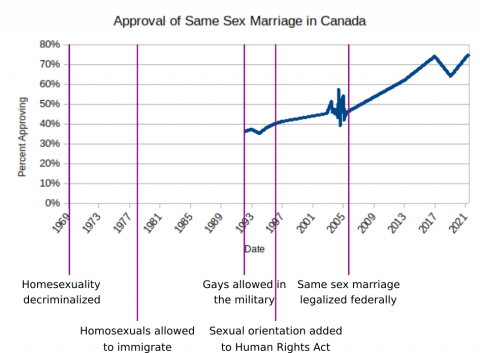
- Analysis, Predictions, and Future Work
What links can you find between the data and the background research? What limitations are there to your data and analysis? What are the possible sources of error? Are you able to make predictions based on the data? Does your research suggest possibilities for future work? - Links
Provide links for all the data in your spreadsheet, as well as all the research in your word document.
Submit your spreadsheet (with the data and the graph), as well as a text document with answers to the questions above.
Assessment
- Required Parts
- Spreadsheet with data and graph(s)
- Answers to all 6 questions (including links to sources)
- Research
- Found the appropriate background information
- Thorough discussion of stakeholders, timeline, and actions
- Data
- Chart with proper labels
- Chart includes annotations from the timeline
- Analysis, Prediction, and Future Work
- Ties together data and research
- Shows understanding of social context of the issue
| Required Parts |
Research |
Data |
Analysis, Prediction, and Future Work |
|
|---|---|---|---|---|
| 1. Beginning | Most |
Shallow |
Lots of Mistakes |
Simple or Incomplete |
| 2. Developing | - | Okay |
Some Mistakes |
Okay |
| 3. Applying | ✓ | ✓ |
✓ | ✓ |
| 4. Extending | - |
- |
- | Sophisticated |